…
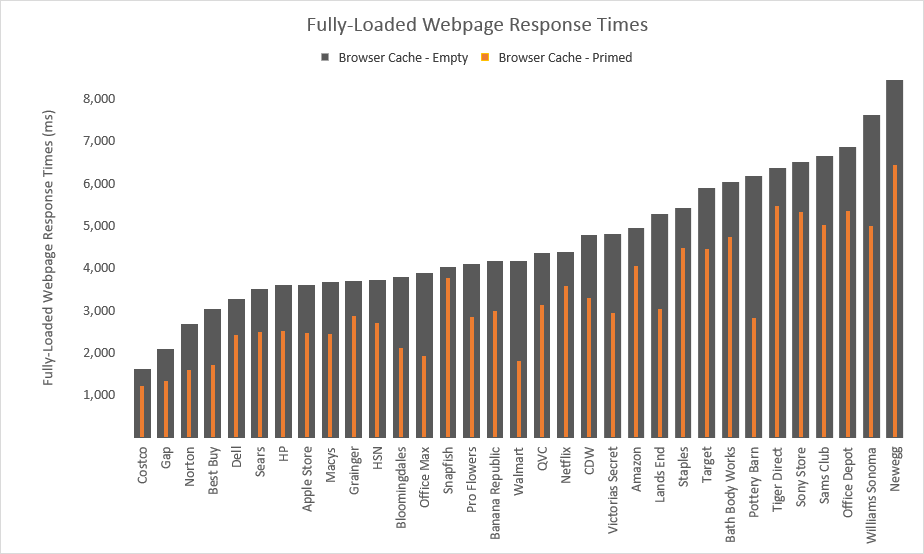
Use a multi-width column (or bar) chart to show change between two data (e.g. performance of a page load with an empty browser cache versus performance of a page load with a primed browser cache).
Download Excel file here.
Credit and thanks to Jon Peltier for writing how to do this in Excel.


