…
Response:
Hello! This Webtortoise post was written 2014-JUN-30 at 09:01 PM ET.
Callouts:
#- Use a Slopegraph to display, “change between two data”. For example, use a Slopegraph to display the change in Performance between a, “page load with an empty browser cache” versus a, “page load with a primed browser cache”.
#- In his [recommend you read this] document, Stephen Few talks about using a Slopegraph to display change between two points in time. So, special callout am using the Slopegraph to display change between two non-time points (in this case, “Browser Cache: Empty” versus, “Browser Cache: Primed”.
#- When using a Slopegraph to show Rank, put the “Fastest” time at the Top (more on this below).
#- Usual Webtortoise disclaimers apply. Whether it’s Document Complete versus Render Start, or IE versus Chrome, or Synthetic versus RUM or “X” versus “Y”… it’s the underlying chart/graph principles that are important.
Story:
Hello everyone. In this WebTortoise Story, am going to use a Slopegraph to visualize the rank in Page Load Times RE: an Empty Browser Cache versus a Primed Browser Cache. Traditional data tables or bar graphs have always been used for this, but as Webtortoise is about the many different ways to visualize web performance data, let us begin.
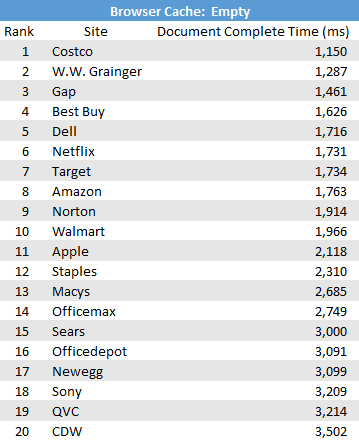
First, consider a general data table (not unlike the one below). It is showing the “Empty Cache” Average Document Complete Time (in ms) for some of the Internet’s top retail sites:
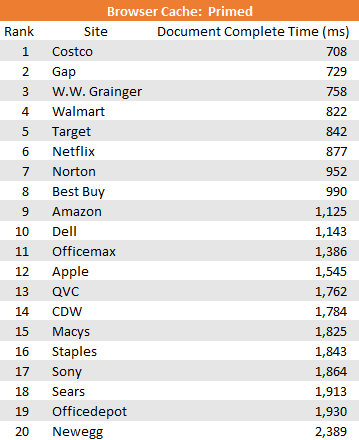
Second, consider a similar general data table showing the “Primed Cache” average Document Complete Time (in ms) for those same sites.
Pause….
Now consider such questions as:
— What is the rank of sites when considering an empty browser cache versus when considering a primed browser cache?
— Does the ordinal rank change? And if so, by how much?
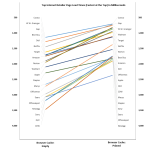
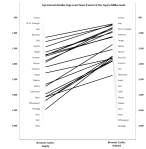
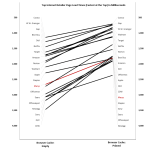
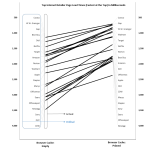
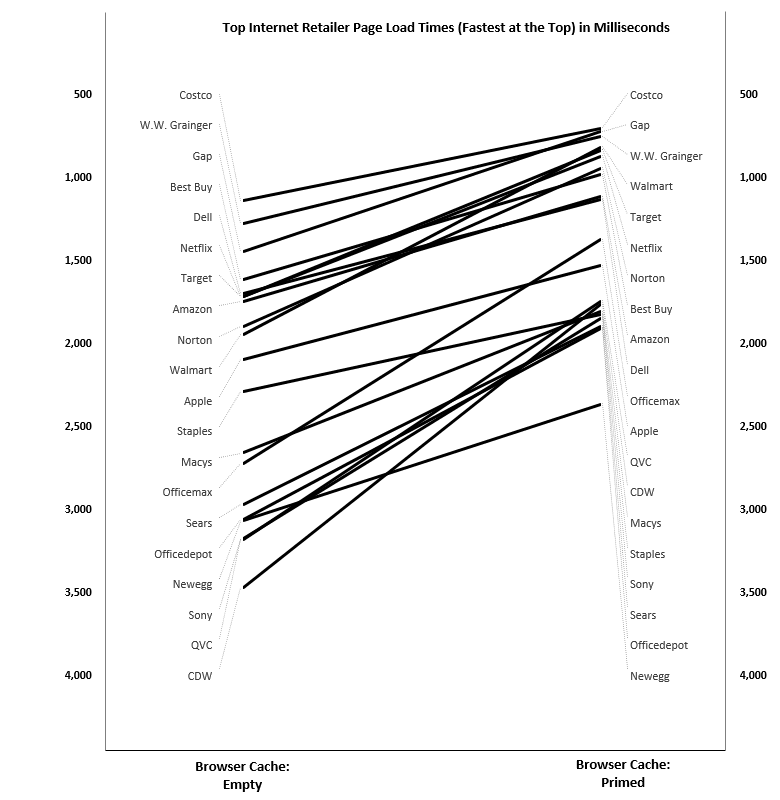
Now… place the tables side-by-side, draw lines between them and voila! you have your Slopegraph:
Fastest at the Top
There was much debate about whether or not the “fastest” site should be at the “top” or at the “bottom”. Since were making a natural progression from a basic data table (which normally has the “fastest” at the top), decided to keep the “fastest” at the top when constructing the Slopegraph.
A Closer Look
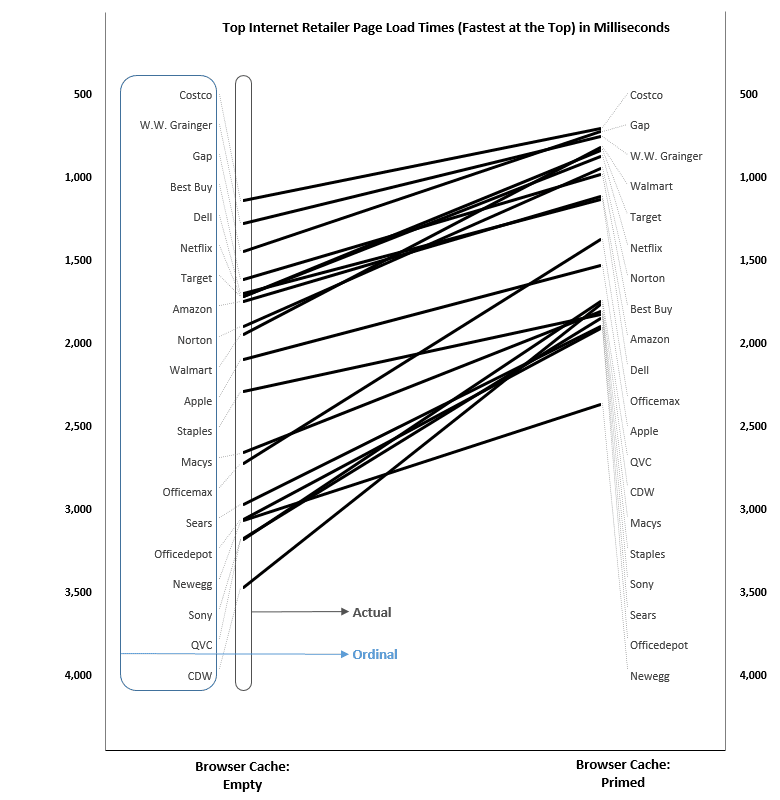
One of the powerful capability assets of the Slopegraph is you get to visualize both, “the actual rank” and, “the ordinal rank”. This is exceptionally powerful because when you have *just* the data table, it’s tougher to do things like see clusters, compare magnitudes of change or see rank change(s).
In other words, the ordinal rank says, “So and so is first, such and such is second and so on”. But it does not say, “By how much is such and such second”? That’s why the visual is recommended because it conveys some of this certain information with much less exerted brainpower.
Optional Reading Material:
Download Excel: https://drive.google.com/file/d/0B9n5Sarv4oonTVd3dm01YWd1dlk/edit?usp=sharing
LinkedIn: http://www.linkedin.com/in/leovasiliou
Twitter: @LvasiLiou
#Analytics #CatchpointUser #ChartsAndDimensions #ChartsAndGraphs #Performance #SiteSpeed #WebPerformance #Webtortoise #WebPerf #WPO #DataVis
#ExcelSlopeGraph #CompetitiveBenchmark #CacheIsKing
